Monitoring MongoDB Performance With ELK Stack
This article assumes that you have some experience with MongoDB. Otherwise, you can refer to the MongoDB documentation to learn more about MongoDB.
What We Are Going to Build

A Kibana dashboard to display MongoDB metrics such replication lag and RAM usage. You can customize this dashboard to satisfy your requirements. Best of all, it is completely free of charge!
Why We Are Building This
To monitor MongoDB performance, I would personally recommend using MongoDB Cloud Manager as the main monitoring tool. It provides complete monitoring and alerting feature, officially supported by MongoDB team. However, it has some limitations in its free version such as limited data retention of 24 hours. The Kibana dashboard that we are going to build can supplement MongoDB Cloud Manager as it is more customizable and we can adjust how long it keeps the metric data.
Overview
The objective of this article is to use ELK stack to monitor MongoDB metric status obtained by using Metricbeat. The metric collected from the servers may contain many useful components such as memory usage, opcounters, etc. that can help us for troubleshooting.

Based on the architecture above, the flow of data is as below:
-
Beats (includes Filebeat, Metricbeat and others) will collect necessary data in a server. You need to install the necessary Beats in every server you want to monitor.
-
Logstash is used to parse (using Grok) and aggregate the incoming data from the Beats. Usually you have one server with Logstash installed to cater to many servers sending data via Beats.
-
Logstash will pass the parsed data to Elasticsearch, the data storage. In a more robust setup, you will need to setup more than one instance of Elasticsearch for redundancy and to increase capacity.
-
Kibana’s role is to retrieve the data in Elasticsearch and display it in various shape such as pie chart or histogram.
Kibana dashboard that we are going to build can supplement MongoDB Cloud Manager
Setup
The rest of this article is just a brief run through on how to setup the ELK stack. I would recommend you to go to the official documentation for more details.
Please note that we will do everything in a single machine (Ubuntu 16.04) and it is only for testing. The real production set up usually involves multiple server in different machines and Metricbeat needs to be installed on each server that we want to monitor.
Install Java
sudo apt-get update
sudo apt-get install default-jdk
Install Elasticsearch
Elasticsearch is essentially a data storage with a very powerful search capability. Some even argue it can replace MongoDB completely but that discussion deserves another post so I will not elaborate here :)
curl -L -O https://artifacts.elastic.co/downloads/elasticsearch/elasticsearch-6.2.3.tar.gz
tar -xvf elasticsearch-6.2.3.tar.gz
cd elasticsearch-6.2.3/bin
nohup .elasticsearch &
You can open your browser and go to localhost:9200 to check Elasticsearch is running. You will see some statements that end with "tagline" : "You Know, for Search"
Install Logstash (optional)
Logstash is used for further processing of the data collected by Metricbeat (or other ‘beat’ such as Packetbeat or Filebeat). It is a powerful tool to do pipelining, all centralized in one place.
Download and install the Public Signing Key:
wget -qO - https://artifacts.elastic.co/GPG-KEY-elasticsearch | sudo apt-key add -
You may need to install the apt-transport-https package on Debian before proceeding:
sudo apt-get install apt-transport-https
Save the repository definition to /etc/apt/sources.list.d/elastic-5.x.list:
echo "deb https://artifacts.elastic.co/packages/5.x/apt stable main" | sudo tee -a /etc/apt/sources.list.d/elastic-5.x.list
Run sudo apt-get update and the repository is ready for use. You can install it with:
sudo apt-get update && sudo apt-get install logstash
sudo service logstash start
To make sure it runs, execute the following command:
sudo service logstash status
Install Metricbeat
From the documentation, installing via .deb package:
curl -L -O https://artifacts.elastic.co/downloads/beats/metricbeat/metricbeat-6.2.3-amd64.deb
sudo dpkg -i metricbeat-6.2.3-amd64.deb
Configure Metricbeat by modifying /etc/metricbeat/metricbeat.yml
sudo vim /etc/metricbeat/metricbeat.yml
  metricbeat.modules:
  - module: mongodb
    metricsets: ["dbstats", "status"]
    period: 10s

    # The hosts must be passed as MongoDB URLs in the format:
    # [mongodb://][user:pass@]host[:port].
    # The username and password can also be set using the respective configuration
    # options. The credentials in the URL take precedence over the username and
    # password configuration options.
    hosts: ["localhost:27017"]

    # Username to use when connecting to MongoDB. Empty by default.
    #username: user

    # Password to use when connecting to MongoDB. Empty by default.
    #password: pass
If you want to use Logstash for processing, edit the part in the config file as follows.
  output.logstash:
    hosts: ["localhost:5044"]
Parsing and creating grok rules for logstash is outside of the scope of this article. You can refer here for a guide. Otherwise, you can ship the metric data to Elasticsearch directly.
  output.elasticsearch:
    hosts: ["localhost:9200"]
Finally, restart Metricbeat to reread its configuration: sudo service metricbeat restart
Install Kibana
sudo apt-get update && sudo apt-get install kibana sudo -i service kibana start
Now Kibana is running, access localhost:5601 via your browser. You can learn more about how to use Kibana here.
Setup Kibana dashboard
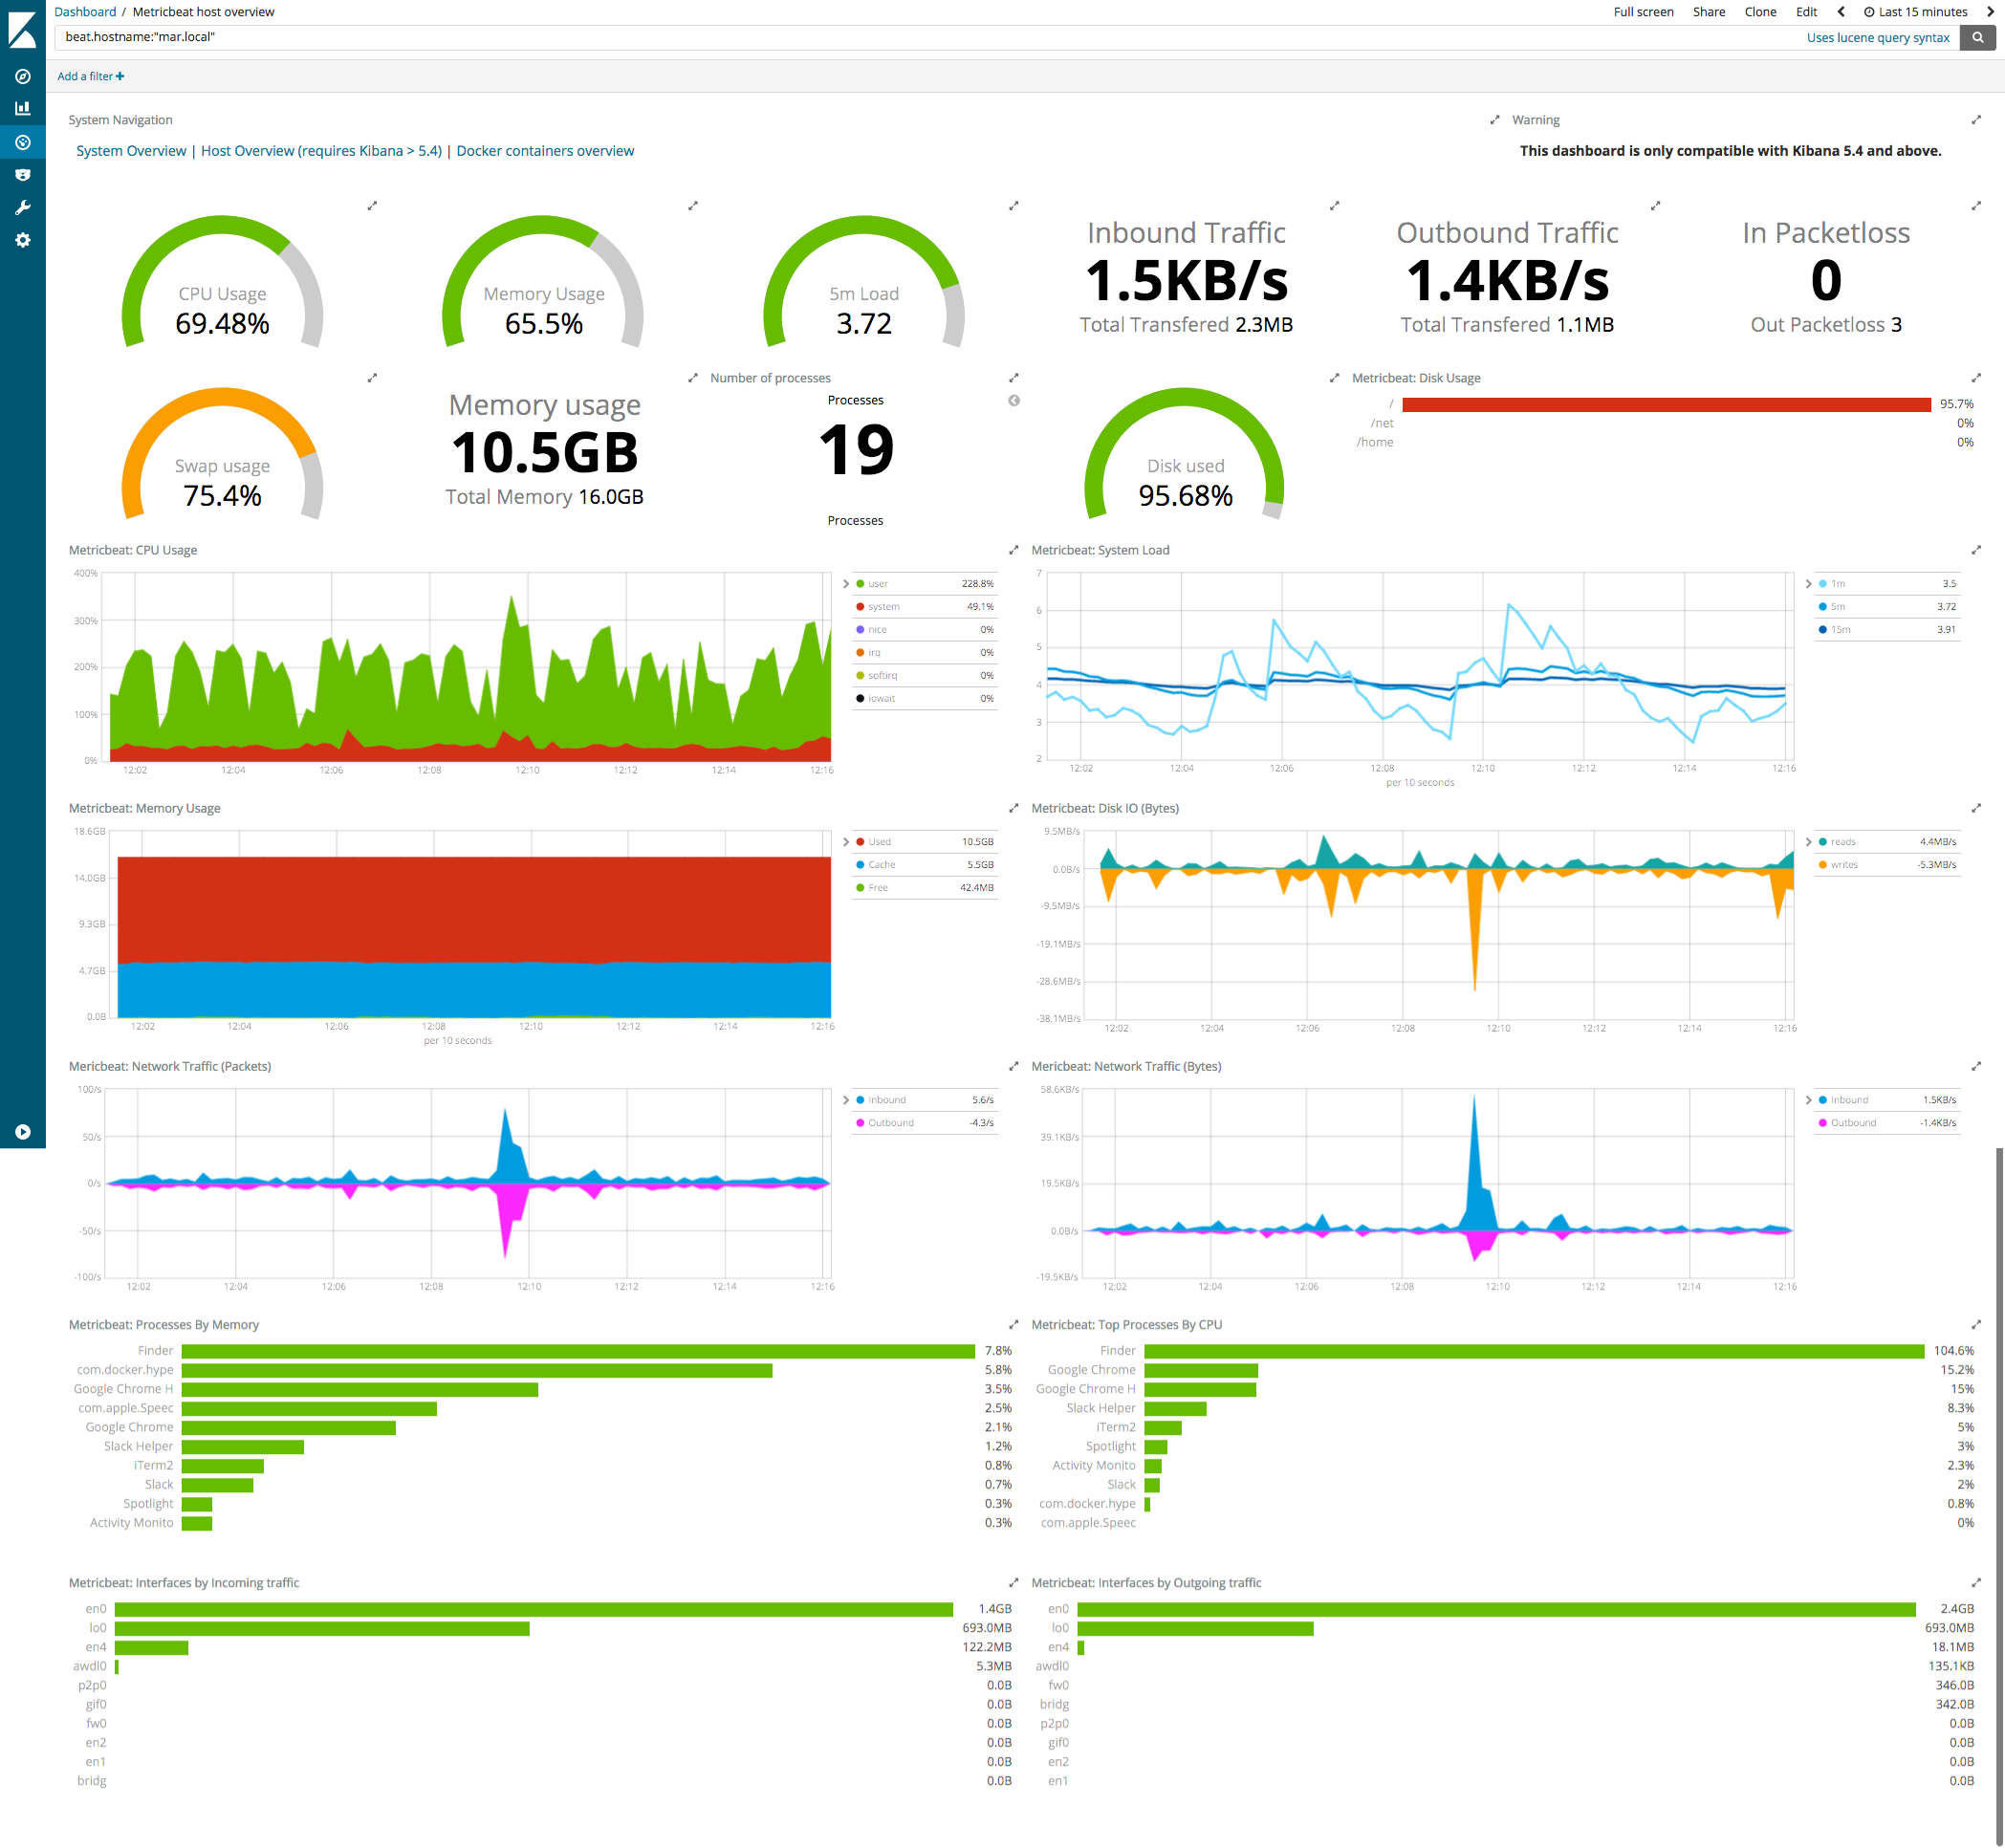
The awesome feature of Metricbeat is that it comes with pre-built dashboard that we can use to monitor our servers. To add them, run metricbeat setup --dashboards and that’s it!
After a while, you will see some data in Kibana interface. The next step is to customize the dashboard to suit your specific needs. Have fun!