Improving Trading Back Test Tool

Update: the app is renamed into Data Driven Trader and can be accessed here
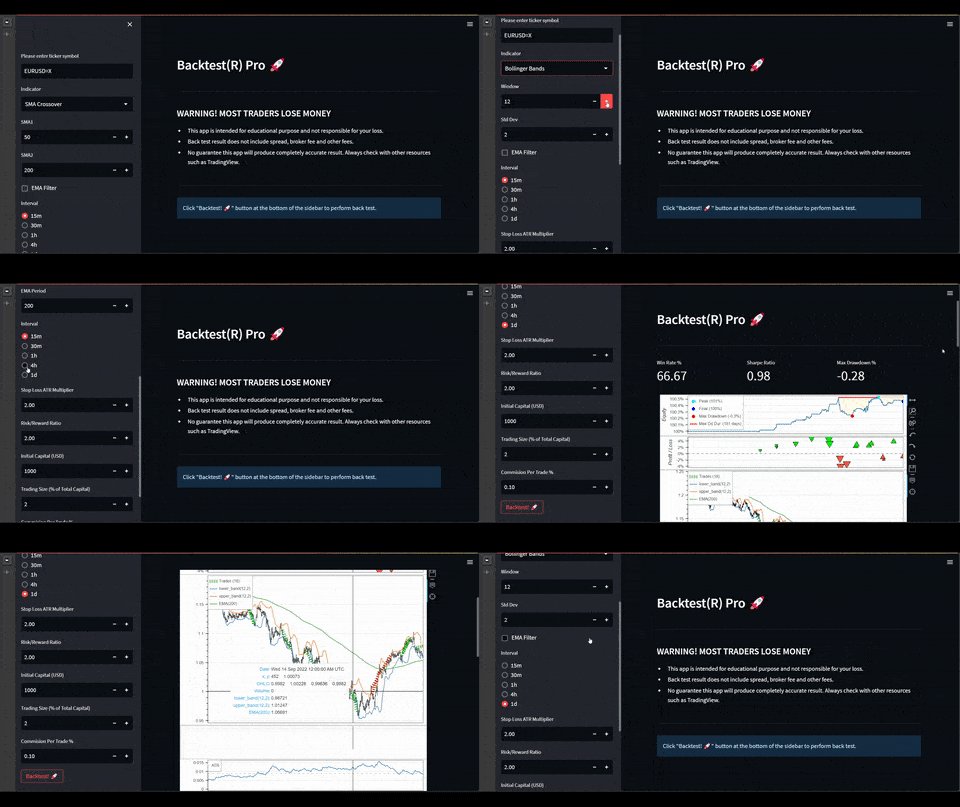
I realized there are useful metrics that I would like to add to the back testing app called Backtest(R) that I wrote in this article. As can be seen on the gif above, the app still has the original options to specify trade configuration such as indicator parameters, stop loss, and EMA filter. ‘Commission’ configuration is a new option. It is useful to simulate commission per trade as most brokers charge it.
Then I found this useful library called backtesting.py. It performs most of the heavy lifting. I leveraged the awesome library to create Backtest(R) Pro! 🚀
While basic back testing is clearly explained in the documentation, one has to find a way to add custom indicators such as MACD and Bollinger Bands. In addition, I wanted to combine backtesting.py with Streamlit as UI, so the challenge is to connect these two tools. Streamlit allows caching thus it is blazing fast when we test the same data and only changing the trade strategy parameters.
Back test results produced by the backtesting.py library is comprehensive. I only displayed Sharpe ratio, win rate and max drawdown but there are many more e.g. return, buy and hold return and volatility.
With this improved version, we can see more clearly how most trading strategies are not profitable 💸