Showing SQL On Jupyter Notebook Using DuckDB
Problem:
Need to analyze huge data using SQL and show the results on a Jupyter notebook.
Solution:
Recently DuckDB caught my attention. It is designed to be a fast online analytical processing (OLAP) DB that does not need separate DB server installation.
import duckdb
That’s it. Now we have a fully functional relational database. Connecting to the DB is as easy as:
conn = duckdb.connect('e-commerce.duckdb')
Let’s create a tiny dataset to test the power of DuckDB.
conn.execute("""
             -- Create the Products table
CREATE TABLE products (
    product_id INT PRIMARY KEY,
    product_name VARCHAR(255),
    price DECIMAL(10, 2),
    category VARCHAR(50)
);

-- Insert sample data into the Products table
INSERT INTO products (product_id, product_name, price, category)
VALUES
    (1, 'Laptop', 999.99, 'Electronics'),
    (2, 'Smartphone', 499.99, 'Electronics'),
    (3, 'Headphones', 79.99, 'Electronics'),
    (4, 'T-shirt', 19.99, 'Clothing'),
    (5, 'Jeans', 39.99, 'Clothing');

-- Create the Sessions table with marketing traffic columns
CREATE TABLE sessions (
    session_id INT PRIMARY KEY,
    user_id INT,
    utm_source VARCHAR(255),
    utm_type VARCHAR(255),
    device_type VARCHAR(50),
    session_date DATE
);

-- Insert sample data into the Sessions table
INSERT INTO sessions (session_id, user_id, utm_source, utm_type, device_type, session_date)
VALUES
    (1, 101, 'google', 'brand', 'mobile', '2023-09-28'),
    (2, 102, 'facebook', 'social', 'desktop', '2023-09-28'),
    (3, 103, 'twitter', 'social', 'mobile', '2023-09-27'),
    (4, 104, 'google', 'brand', 'mobile', '2023-09-27'),
    (5, 105, 'instagram', 'social', 'desktop', '2023-09-26');

-- Create the Orders table
CREATE TABLE orders (
    order_id INT PRIMARY KEY,
    user_id INT,
    session_id INT,
    product_id INT,
    quantity INT,
    order_date DATE
);

-- Insert sample data into the Orders table
INSERT INTO orders (order_id, user_id, session_id, product_id, quantity, order_date)
VALUES
    (1, 101, 1, 2, 2, '2023-09-28'),
    (2, 102, 2, 1, 1, '2023-09-28'),
    (3, 103, 3, 3, 1, '2023-09-27'),
    (4, 104, 4, 2, 3, '2023-09-27'),
    (5, 105, 5, 4, 2, '2023-09-26');
             """)
<duckdb.duckdb.DuckDBPyConnection at 0x2bd1c1cf470>
Now we can perform SQL query to process the data using sql() command. We can directly display the nicely formatted results on Jupyter notebook. Great! 🚀
conn.sql('SELECT * FROM orders')
┌──────────┬─────────┬────────────┬────────────┬──────────┬────────────┐
│ order_id │ user_id │ session_id │ product_id │ quantity │ order_date │
│  int32   │  int32  │   int32    │   int32    │  int32   │    date    │
├──────────┼─────────┼────────────┼────────────┼──────────┼────────────┤
│        1 │     101 │          1 │          2 │        2 │ 2023-09-28 │
│        2 │     102 │          2 │          1 │        1 │ 2023-09-28 │
│        3 │     103 │          3 │          3 │        1 │ 2023-09-27 │
│        4 │     104 │          4 │          2 │        3 │ 2023-09-27 │
│        5 │     105 │          5 │          4 │        2 │ 2023-09-26 │
└──────────┴─────────┴────────────┴────────────┴──────────┴────────────┘
A more complex query can be done too. Suppose we want to see a breakdown of product with the highest quantity for each day and curious to know which marketing campaign produced the traffic.
conn.sql(
    """
    WITH daily_product_rank AS (
        SELECT
        o.product_id as product_id,
        o.order_date as order_date,
        s.utm_type as utm_type,
        RANK () OVER (
            PARTITION BY o.order_date
            ORDER BY o.quantity
            ) as quantity_rank
        FROM orders o LEFT JOIN sessions s
            ON o.session_id = s.session_id
        ORDER BY o.order_date
    )
    SELECT *
    FROM daily_product_rank
    WHERE quantity_rank = 1
    """
)
┌────────────┬────────────┬──────────┬───────────────┐
│ product_id │ order_date │ utm_type │ quantity_rank │
│   int32    │    date    │ varchar  │     int64     │
├────────────┼────────────┼──────────┼───────────────┤
│          4 │ 2023-09-26 │ social   │             1 │
│          3 │ 2023-09-27 │ social   │             1 │
│          1 │ 2023-09-28 │ social   │             1 │
└────────────┴────────────┴──────────┴───────────────┘
The power of DuckDB can be combined with Pandas too.
import pandas as pd

df = conn.sql("""
         SELECT
            p.product_name,
            COUNT(DISTINCT o.order_id) as order_count,
         FROM orders o LEFT JOIN products p
            ON o.product_id = p.product_id
         GROUP BY p.product_name
         ORDER BY order_count DESC
         """).to_df()

df = df.set_index('product_name')
print(df.to_markdown())
| product_name   |   order_count |
|:---------------|--------------:|
| Smartphone     |             2 |
| T-shirt        |             1 |
| Laptop         |             1 |
| Headphones     |             1 |
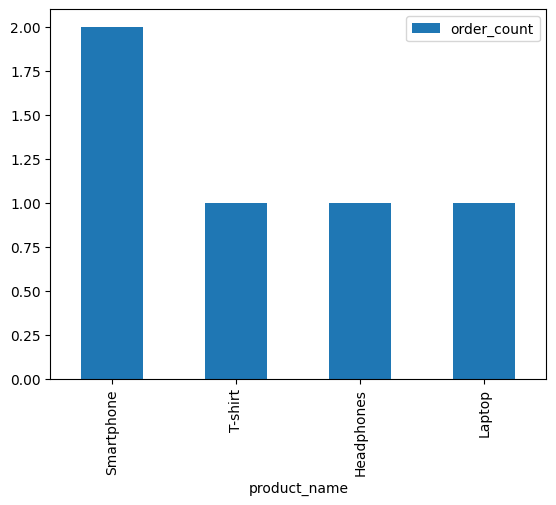
Here I just give a simple bar chart example for products and their order counts. We can create visualizations with popular library such as Seaborn or Plotly as needed.
df.plot(kind='bar')
<Axes: xlabel='product_name'>

Awesome! It is important to note that DuckDB is not optimized for high write load. So it is not meant to replace other traditional databases, at least for now 🦆.
Lastly, remember to close the connection.
Cheers!
conn.close()